Measuring the Traction Limits and Suspension Forces of a Formula SAE Racecar

Measuring the Traction Limits and Suspension Forces of a Formula SAE Racecar

Timeline:
Spring 2018

Tools used:
Data acquisition system with linear potentiometers and accelerometers, SolidWorks, MATLAB

Background

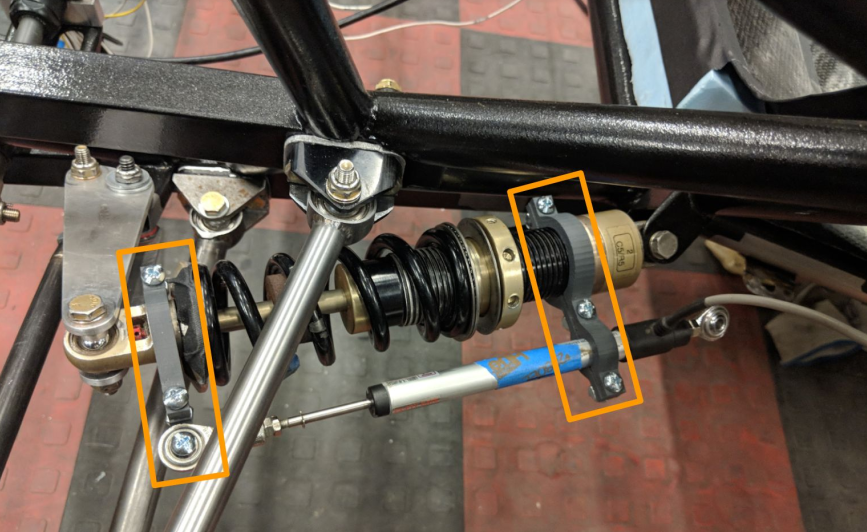
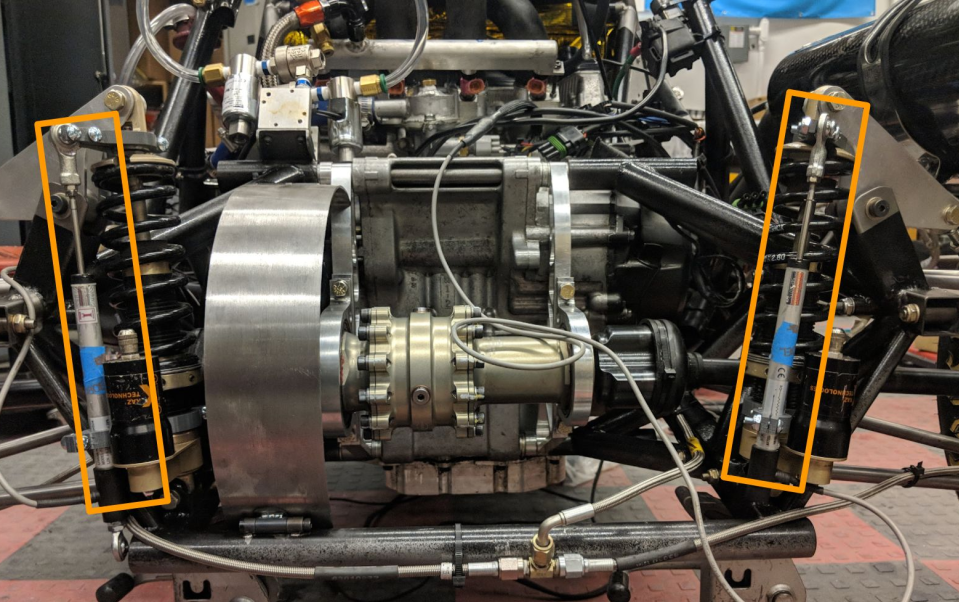
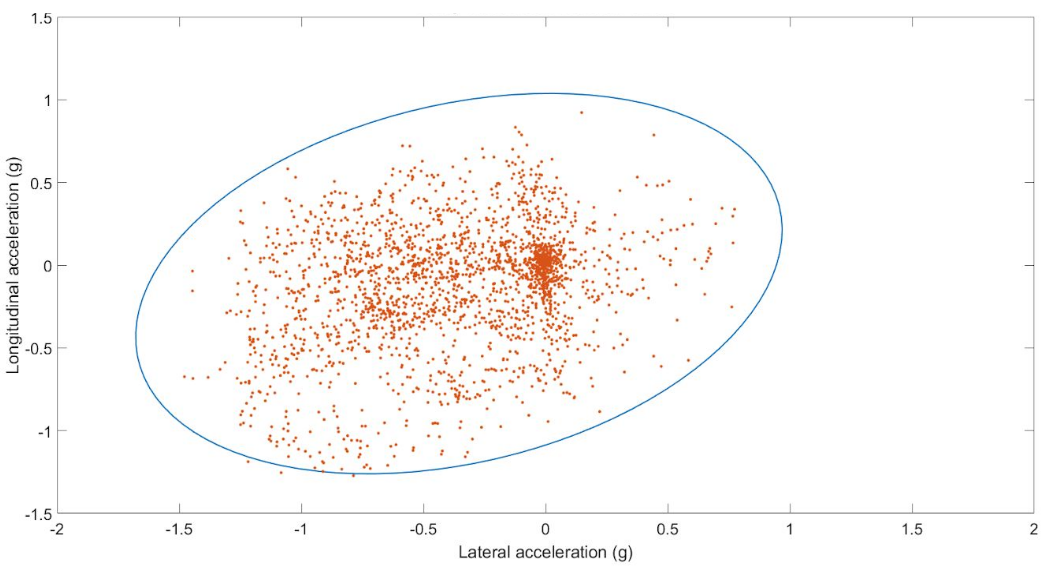
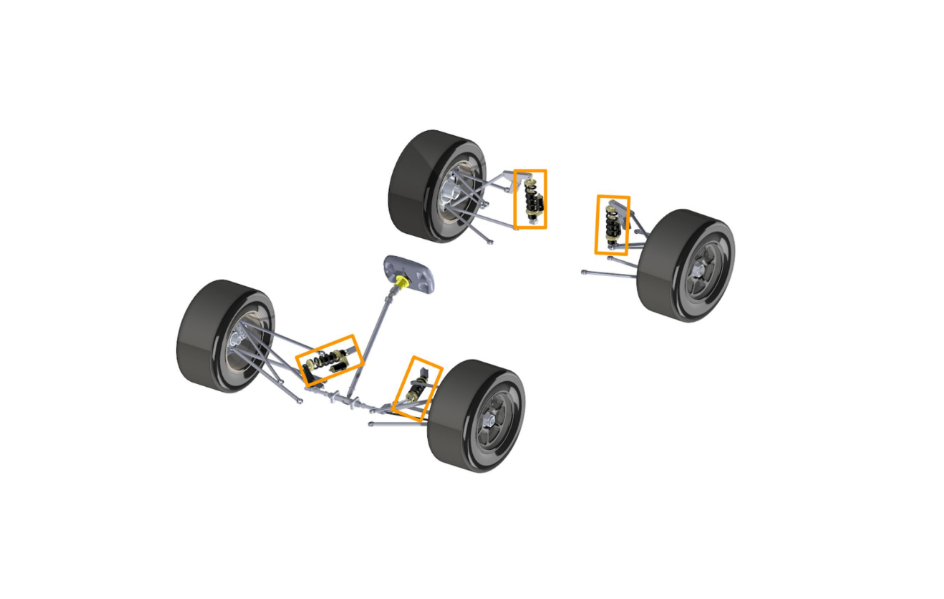
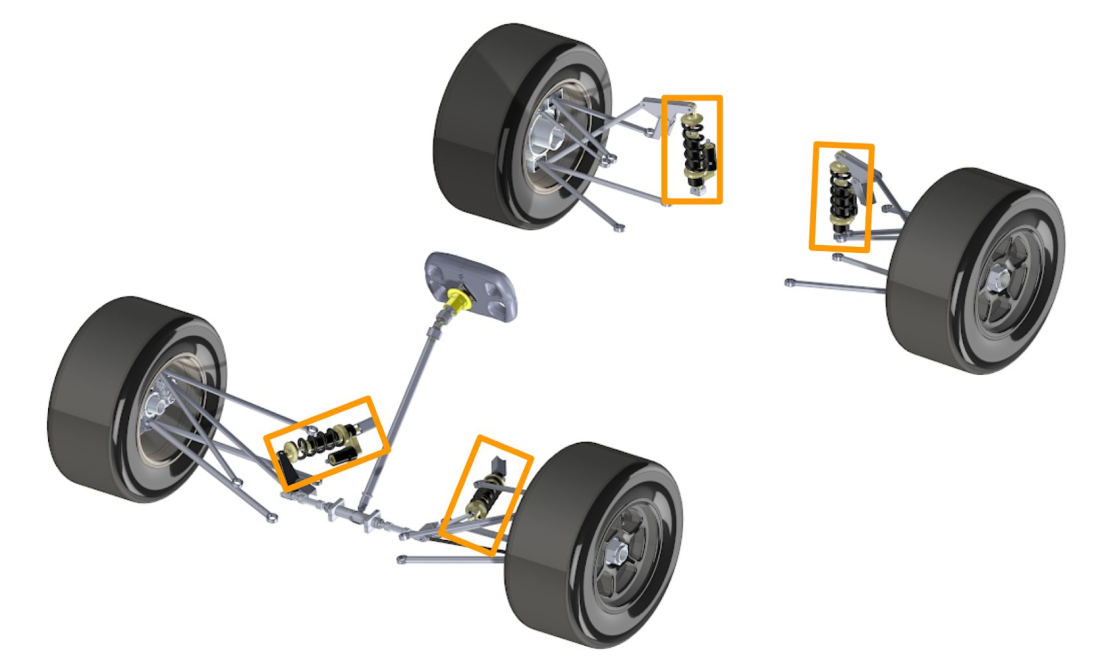
The goal of this project was to utilize an onboard data acquisition system to accurately determine the loading distribution in the Cooper Union Formula SAE racecar suspension system during a typical autocross event. Each corner of the vehicle was equipped with a coilover-linear potentiometer system; the force exerted on each suspension member was calculated using real-time displacement data along with the spring constant and damper coefficient for each coilover. Using these suspension forces, we determined the force exerted on each tire and used this value as a baseline to enhance suspension system effectiveness. Additionally, a traction circle (a plot showing the extents of lateral and longitudinal acceleration of the vehicle during the autocross event) was generated for a set of drivers to identify weak areas among drivers and compare actual vehicle performance relative to design constraints.
Project Description

We characterized the suspension performance of the 2018 Cooper Motorsports FSAE vehicle under accelerating, braking, and cornering conditions by placing linear potentiometers alongside the coilover shocks of the suspension system and recording their deflections during a test autocross event. These deflections were used to calculate the movement of the suspension system. Using known spring and damping coefficients, we calculated the force through the spring-damper system, which was then used to determine the weight on the tires. Understanding these loads was essential for minimizing the weight of the suspension system and ensuring its structural integrity. This knowledge also aided in applying suspension theory to future vehicle designs.

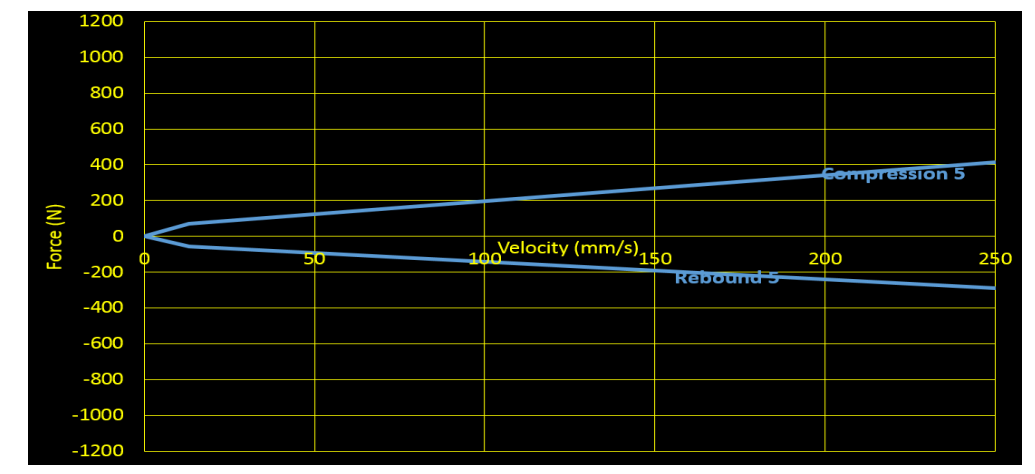
The coilover model used already had a fixed specification for the spring constant. The damper coefficient was determined using manufacturer-provided damper curves.

Experimental Setup

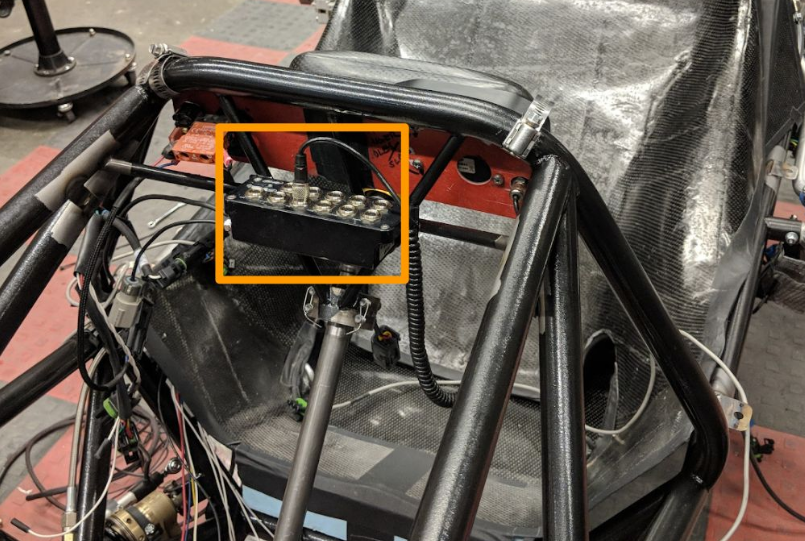
A set of PZ-12-A-75P linear potentiometers with a 75mm stroke was used to measure the forces in the suspension system. An AiM Evo 4 data logger with an onboard accelerometer and GPS and a sampling rate of 10 Hz was used to acquire traction circle data.


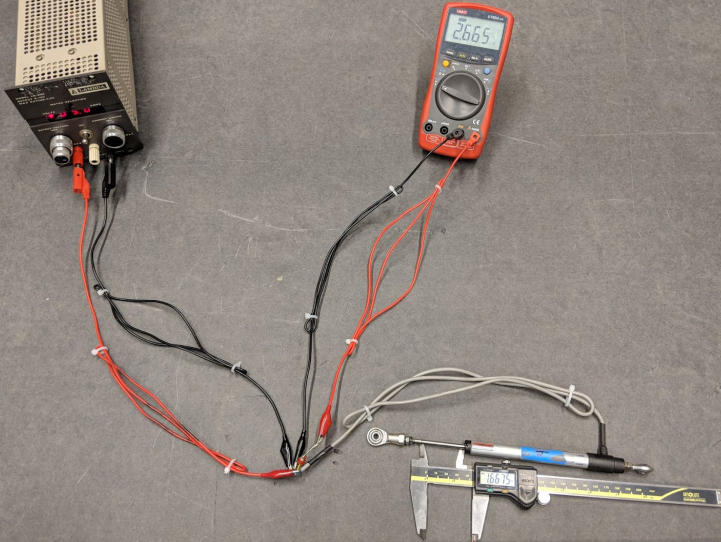
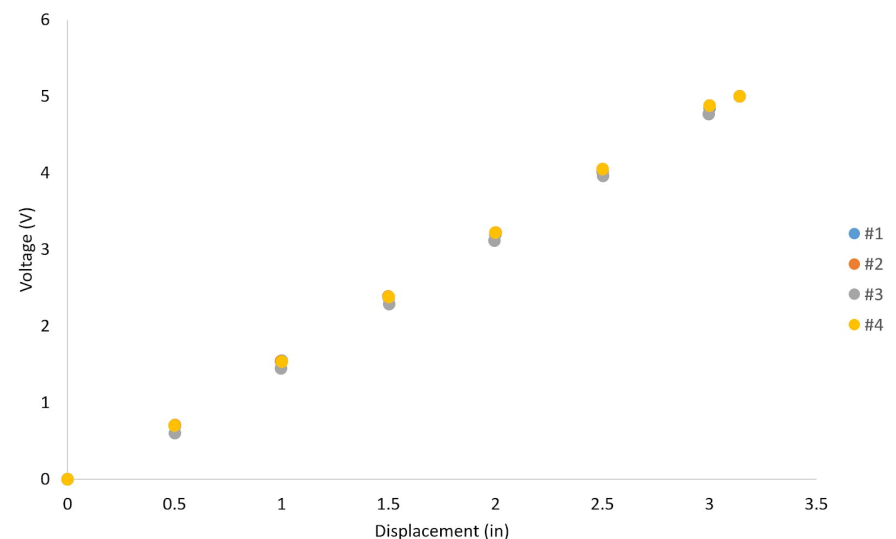
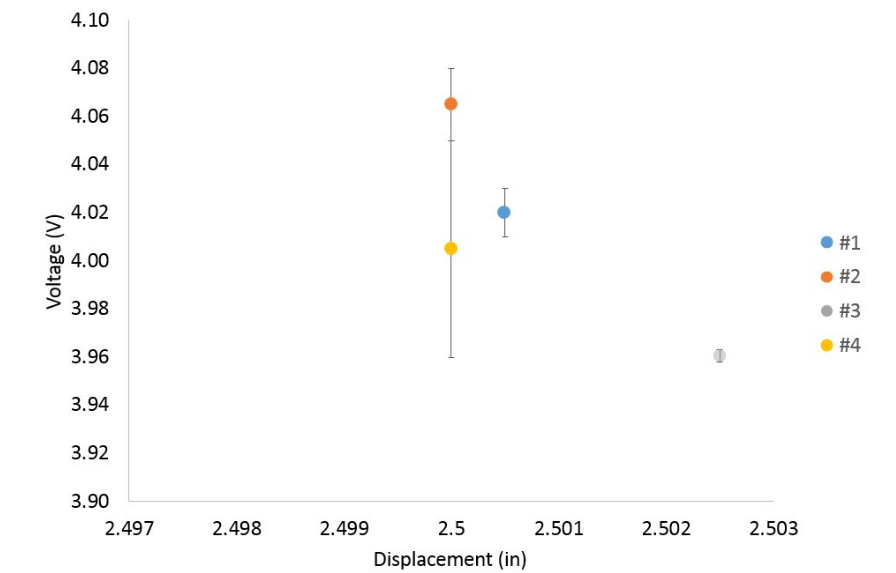
Each linear potentiometer was calibrated by supplying the potentiometers with a fixed voltage and recording the voltage output under both lengthening and shortening events to account for hysteresis. Calibration results and error bars indicated reliable and repeatable behavior without any discernible hysteresis.


Results

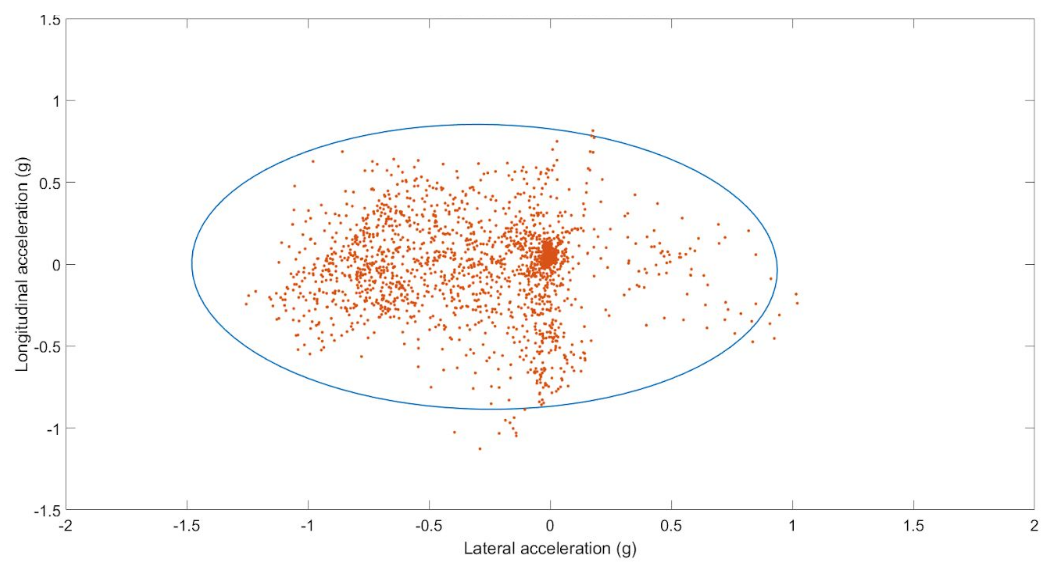
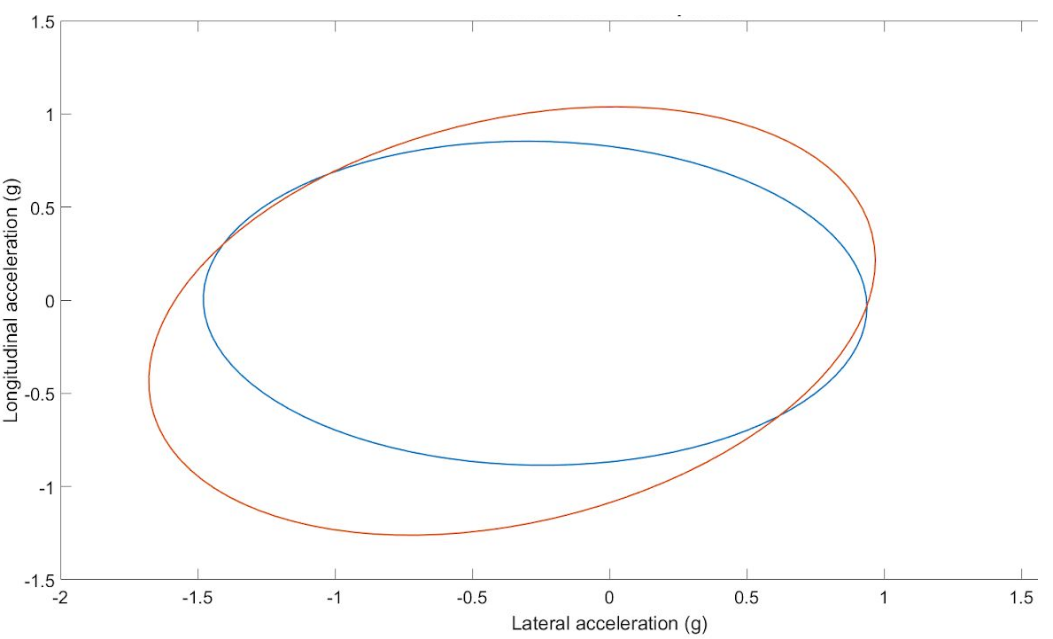
The data logger recorded data for five different drivers on autocross, acceleration, and skidpad courses. Acceleration data from the autocross course was used to produce traction circles for the two drivers who drove that course. A comparison between the two drivers’ traction circles indicated that, while both drivers had similar lateral accelerations, Driver One achieved higher longitudinal accelerations. This suggested that Driver Two had room for improvement in maximizing the vehicle’s longitudinal acceleration during the autocross event.

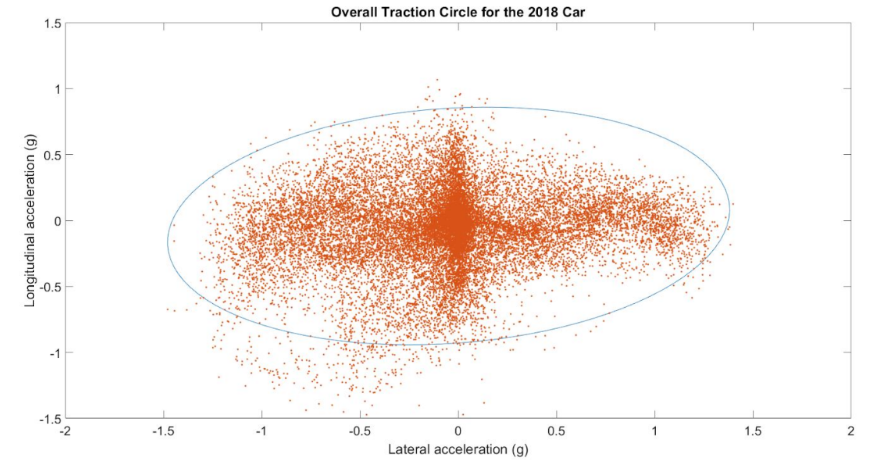
By combining the data from all five drivers, the resulting traction circle demonstrated the overall performance the vehicle was capable of relative to the five drivers who participated in the driving event. The overall traction circle showed a maximum lateral acceleration of approximately 1.5 g’s, which aligned with the predicted maximum lateral acceleration used in designing the 2018 vehicle’s suspension.

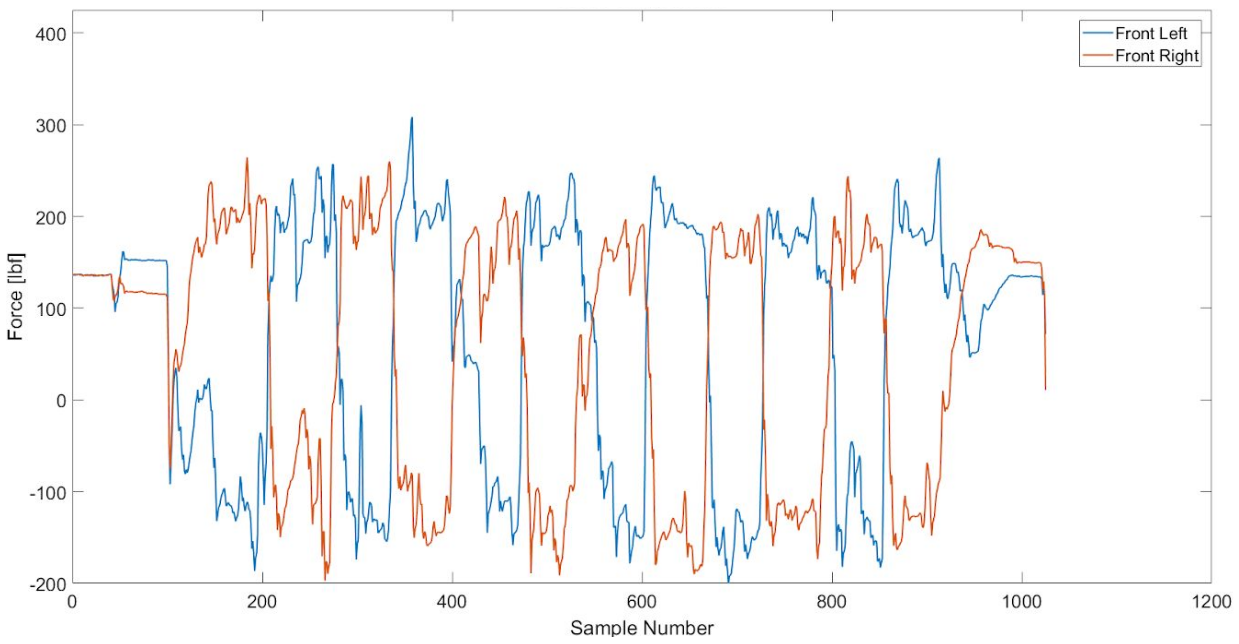
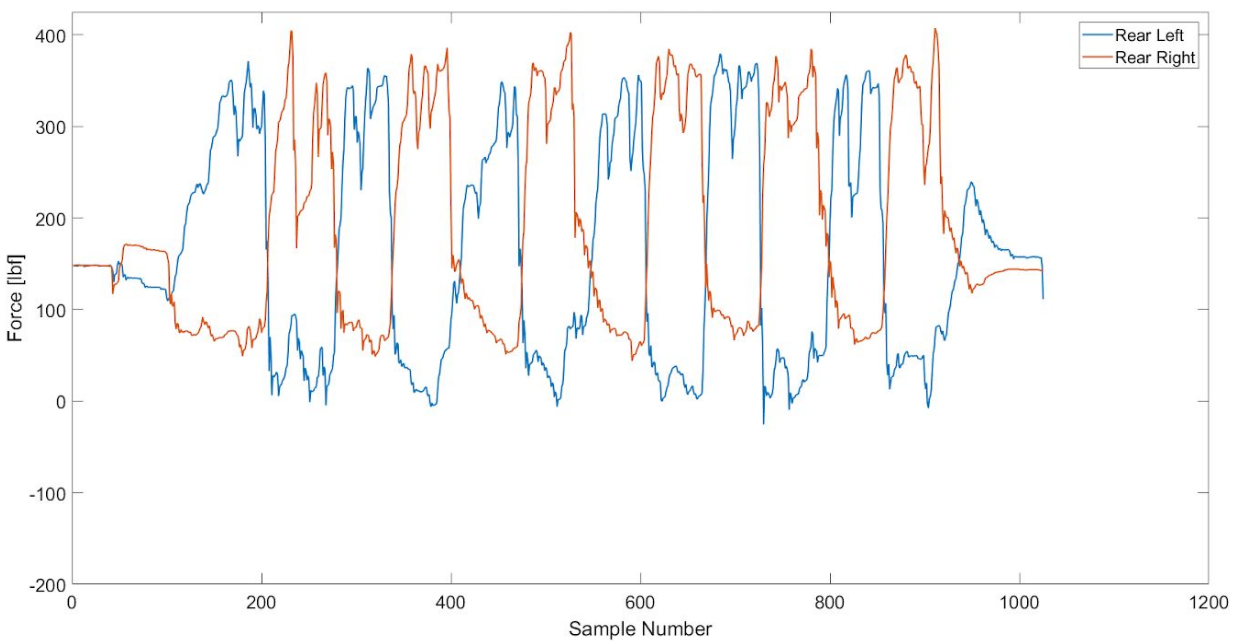
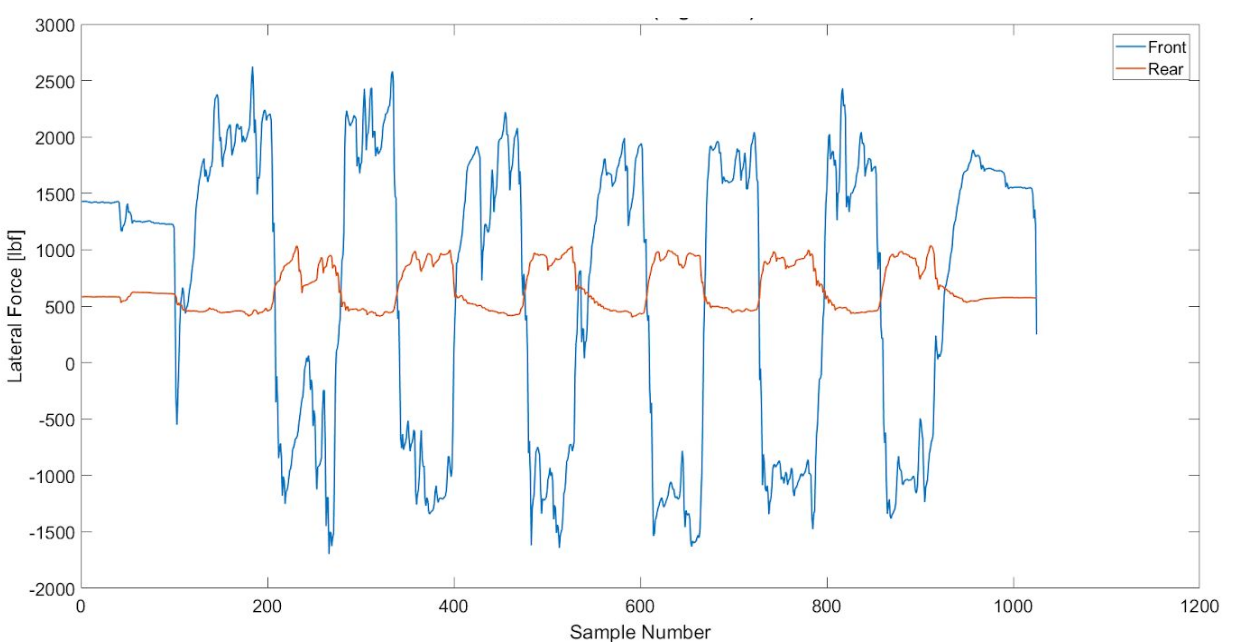
Data from the linear potentiometers was analyzed for the skidpad course. We determined the weight on the front and rear tires and the lateral force produced by the right tires using elementary force balances throughout the event.

A 40-page paper published by the American Society for Engineering Education further detailing the course that allowed us to obtain this data, sensor selection justification, and a full description of how the traction circle was generated can be found here.